2ndgradeworksheets.net-Free worksheets and printables for teachers
Reading and Creating Bar Graph Worksheets
Creating and Reading Bar Graphs, Compare Problems Using Bar Graphs
Common Core State Standards: 2.MD.10 Represent and Interpret Data
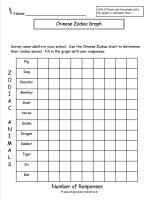 Chinese
New Year Bar Graph
Chinese
New Year Bar Graph
Common Core State Standards:
2.MD.10 Represent and Interpret DataStudents take a survey of birth dates and determine zodiac animal. Results are tallied and used to create a bar graph and pictograph. Includes questions. 4 pages.
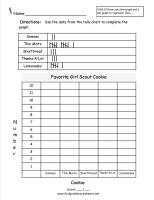 Favorite
Girl Scout Cookies Bar Graph
Favorite
Girl Scout Cookies Bar Graph
Common Core State Standards:
2.MD.10 Represent and Interpret DataStudents can conduct their own survey and create a tally chart or use given completed tally chart to create a bar graph and answer questions. 5 pages.
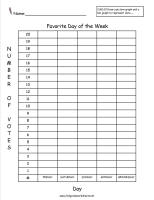 Favorite
Day of the Week Bar Graph
Favorite
Day of the Week Bar Graph
Common Core State Standards:
2.MD.10 Represent and Interpret DataSurvey the class and create a bar graph. 6 pages.
 Favorite
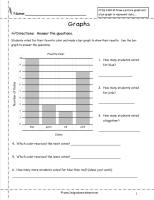
Fruit Bar Graph
Favorite
Fruit Bar Graph
Common Core State Standards:
2.MD.10 Represent and Interpret DataSurvey the class and create a bar graph and pictograph. 6 pages.
 Favorite
Holiday Bar Graph
Favorite
Holiday Bar Graph
Common Core State Standards:
2.MD.10 Represent and Interpret DataSurvey the class and create a bar graph and pictograph. 6 pages.
 Favorite
Pet Bar Graph
Favorite
Pet Bar Graph
Common Core State Standards:
2.MD.10 Represent and Interpret DataSurvey the class and create a bar graph and pictograph. 6 pages.
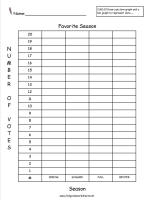 Favorite
Season Bar Graph
Favorite
Season Bar Graph
Common Core State Standards:
2.MD.10 Represent and Interpret DataSurvey the class and create a bar graph and pictograph. 6 pages.
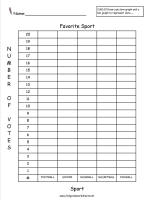 Favorite
Sport Bar Graph
Favorite
Sport Bar Graph
Common Core State Standards:
2.MD.10 Represent and Interpret DataSurvey the class and create a bar graph and pictograph. 6 pages.
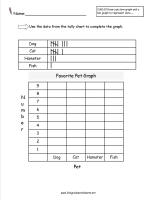
Favorite
Pet Bar Graph
Common Core State Standards:
2.MD.10 Represent and Interpret DataUse the completed tally chart to create a bar graph and pictograph. 3 pages.
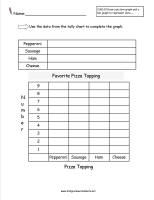 Favorite
Pizza Bar Graph
Favorite
Pizza Bar Graph
Common Core State Standards:
2.MD.10 Represent and Interpret DataSurvey the class or use a completed tally chart to create a bar graph and pictograph. 3 pages.
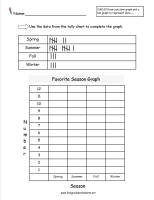 Favorite
Season Bar Graph
Favorite
Season Bar Graph
Common Core State Standards:
2.MD.10 Represent and Interpret DataUse the completed tally chart to complete a bar graph. 3 pages.
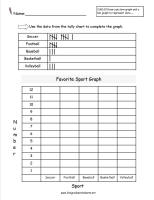 Favorite
Sport Bar Graph
Favorite
Sport Bar Graph
Common Core State Standards:
2.MD.10 Represent and Interpret DataUse the completed tally chart to complete a bar graph. 3 pages.
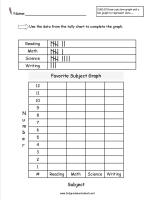 Favorite
Subject Bar Graph
Favorite
Subject Bar Graph
Common Core State Standards:
2.MD.10 Represent and Interpret DataUse the completed tally chart to complete a bar graph. 3 pages.
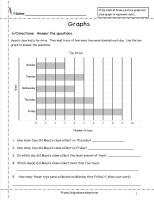 Toy
Drive Bar Graph
Toy
Drive Bar Graph
Common Core State Standards:
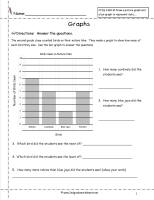
2.MD.10 Represent and Interpret DataStudents interpret the bar graph and answer questions.
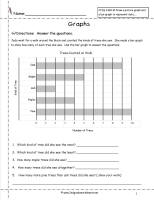 Tree Bar Graph
Common Core State Standards:
2.MD.10 Represent and Interpret DataStudents interpret the bar graph and answer questions.
 Birds Bar Graph
Common Core State Standards:
2.MD.10 Represent and Interpret DataStudents interpret the bar graph and answer questions.
 Favorite
Color Bar Graph
Favorite
Color Bar Graph
Common Core State Standards:
2.MD.10 Represent and Interpret DataStudents interpret the bar graph and answer questions.
 Make
a Bar Graph Choose the Scale
Make
a Bar Graph Choose the Scale
Common Core State Standards:
2.MD.10 Represent and Interpret DataStudents interpret the bar graph and answer questions.
Pick the correct scale to make a bar graph.
 Make
a Bar Graph Choose the Scale
Make
a Bar Graph Choose the Scale
Common Core State Standards:
2.MD.10 Represent and Interpret DataStudents interpret the bar graph and answer questions.
Pick the correct scale to make a bar graph.